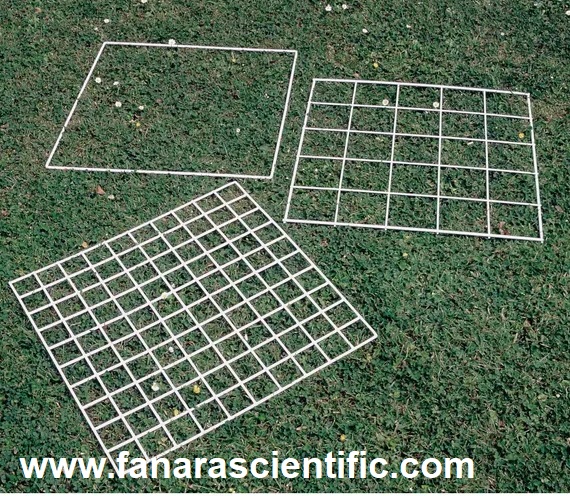
Quadrat 5 x 5 Squares – MAS 5337
Quadrat 10 x 10 Square– MAS 5338
A quadrat is usually a 1 m2 frame. It may contain wires to mark off smaller areas inside, such as 5 × 5 squares or 10 × 10 squares. The organisms underneath, usually plants, can be identified and counted. Quadrats may also be used for slow-moving animals, eg slugs and snails.
What is a quadrat GCSE?
Quadrats. are square frames of wire usually 0.25 m2. These are placed on the ground to look at the plants or slow-moving animals within them. When looking at plants in a quadrat the following sampling can be used: Number of an individual species: the total number of individuals of one species (eg daisies) is recorded.
What is the quadrat method?
Quadrat methods are time-tested sampling techniques that are best suited for coastal areas where access to a habitat is relatively easy. Quadrat sampling has been the main technique used by the Natural Geography in Shore Areas (NaGISA) project.
What is a quadrat sample?
Quadrat sampling is a method by which organisms in a certain proportion (sample) of the. habitat are counted directly. It is used to estimate population abundance (number), density, frequency and. distribution… The quadrat position are chosen randomly or they are placed along a transect.
What is a quadrat for kids?
In quadrat surveys, students map out a square piece of ground and survey the living things lying within the square
How to calculate percentage cover?
Expert Insight: Ground coverage is calculated by dividing the total built-up area by the total plot area and multiplying by 100 to get a percentage.
Frame quadrats
This is a square frame which is used to outline a sample area.
The simplest way to collect data using a frame quadrat is to make a species list for each quadrat. Each species is either present or absent. This allows you to calculate the percentage frequency of each species for the whole sample area.
If a species is present, you can also record how much of there it is. There are two ways of describing the amount of each species within a frame quadrat: percentage cover and local frequency.
Calculating percentage frequency
Percentage frequency is the probability that a species will be found within a single quadrat.\(\mathsf{\% \;frequency = \frac{number\; of\; quadrats\; in\; which\; the\; species\; is\; found}{total\; number\; of\; quadrats}\; \times\;100}\)
Example
An investigation was made into the difference in vegetation between a grazed and an ungrazed section of the fixed dunes. A random sample using 30 frame quadrats is taken in each area. In the grazed area, bird’s-foot trefoil was present in 18 of the 30 quadrats; in the ungrazed area, bird’s-foot trefoil was present in 6 of the 30 quadrats.\(\mathsf{\% \;frequency\;in\;ungrazed\;area = {18}{20}\; \times\;100\;=\;60\%}\)\(\mathsf{\% \;frequency\;in\;ungrazed\;area = {6}{30}\; \times\;100\;=\;20\%}\)
The number of quadrat samples taken affects the reliability of the results. The number must be large enough to minimise the effect of anomalies, but not too large that it cannot realistically be carried out in the time available. lt must also be sufficient for any statistical tests you are using. In practice, 10 quadrat samples is the absolute minimum for each sample area.
Percentage cover and local frequency
Percentage cover is faster but is more subjective. Simply estimate what percentage of the area enclosed by the quadrat is occupied by each species. One drawback of this method is that plants in flower tend to be over-estimated while low-growing plants are under-estimated.
Local frequency is easiest to measure if you have a gridded quadrat of 10 x 10 squares. For each species, count the number of squares which are at least half-occupied. The final figure (which will vary between 1 and 100) is the local frequency. This method is more time consuming than estimating percentage cover, but the results should be more accurate, as there is less risk of over-estimating some plants and under-estimating others.
Point quadrats
A point quadrat is a frame shaped like a T. The bar of the T has ten holes in it, and to sample vegetation a long pin much like a knitting needle is stuck through each hole. The different plants that the pin ‘hits’ as it is pushed towards the ground are identified and counted.
To collect data on abundance, count the first hit made by the pin on each different plant. Count the first hit only.